You know what separates a good implementation from a great implementation? Visualisation. Your users love nothing more than graphics, images or even better: Animations.
- You want to track your sales teams calls? Sure I can build you a Report.
- Oh you want nice graphics. No problem I put it into a dashboard.
- Oh you want it to be animated? A simple KPI like calls? With a target value to push motivation? Ok…?!
Welcome to the world of Lightning Components – and sales reporting.
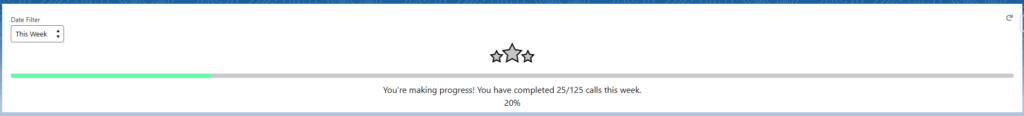
Here is what I build a couple of years back for our sales:
Why? I do believe that a good visualization can make a difference and it was the closest thing I came to a gamification feature in my current work.
First lets talk functionalities:
There is a progress Bar that will fill based on the calls the user made. The Stars represent certain percentages reached and the motivational texts are also bound to certain percentages. Each user has a target value and a filter allows you to switch between today/this week/this month recalculating the target value.
I use calls, but obviously you can use whatever KPI is relevant for you.
What do we need?
- An apex class that queries the relevant data that you want to track – in my case calls – and the target values based on the filter
- A field on an object to store the target value
- A Lightning Component for the graphics and the Animation
- Static ressources for our Stars (yes, those are images)
Here is a top Level overview of how it works:
- User loads the page where we place the Lightning Component – in my case the home page
- Apex class queries the users call target from the user object
- Apex class queries the calls made based on the filter i set
- Lightning Component populates the Bar and gives back the image of the Stars and motivational Phrases i defined in the javascript
- Changing the Filter will trigger the apex class again but with different parameters
The documentation: https://salesforcepanda.com/animated-bar/
Leave a Reply